This is the fourth and final article in a series on RMB internationalization. The first article discussed the RMB’s growing global role and the wins notched up so far. The second article discussed the controls on exchange rate and capital flows and the constraints to full RMB internationalization. The third article discussed the three areas relevant to RMB internationalization going forward.
This article presents ten charts tracing the RMB internationalization journey over the past decade.
Low Hanging Fruit
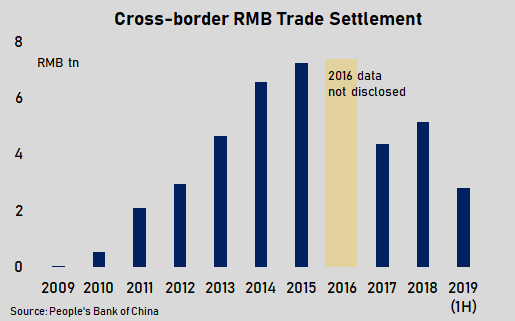
The launch of RMB trade settlement in 2009 laid the foundation for RMB internationalization. Voracious investor appetite for RMB in the early years made it easy to promote trade settlement before it hit a speed bump following the August 2015 currency depreciation.
The CNH Market
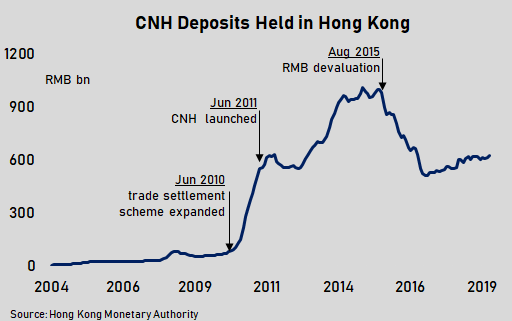
The RMB acquired via trade settlement could be held in offshore deposits and invested in RMB denominated financial products as long as it did not generate any flowback of the currency to the mainland. The offshore RMB was called CNH. Deposits held in CNH peaked at one trillion in December 2014.
RMB as World Payments Currency
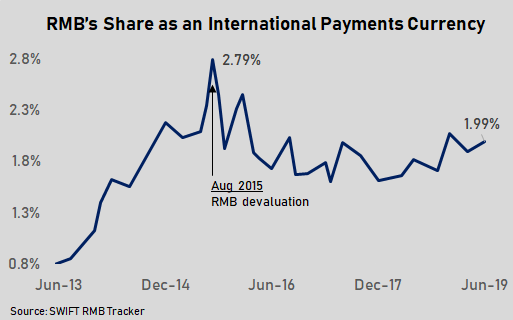
The RMB’s share among currencies used for international payments rose rapidly during the early years of internationalization – from 0.84% (twelfth rank) in August 2012 to a peak of 2.79% (fourth rank) in August 2015. Its share has plateaued since then and its rank stuck at fifth position.
Exchange Rate Management
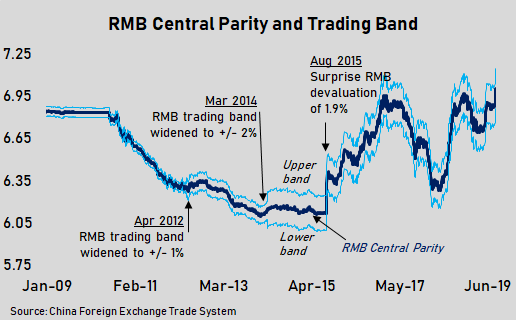
The PBoC manages the RMB exchange rate within a +/-2% range of the RMB central parity announced each day. The band has been widened twice since RMB internationalization began. The ‘exchange rate reform’ of August 2015 resulted in a 1.9% devaluation in the RMB central parity and worsened global RMB sentiment.
Capital Flight
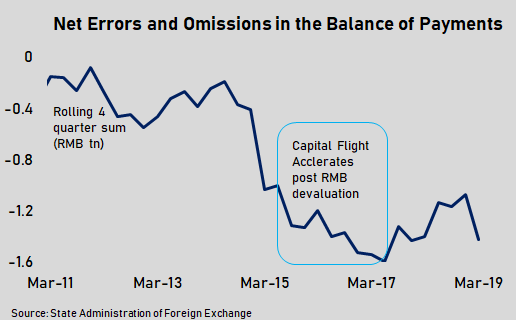
The August 2015 devaluation set in motion a two year long capital outflow estimated at RMB3 tn or USD460 bn just by looking at the balancing item of net errors and omissions (NEO) in the Balance of Payments data, widely regarded as a gauge of capital flight.
Foreign Exchange Reserves
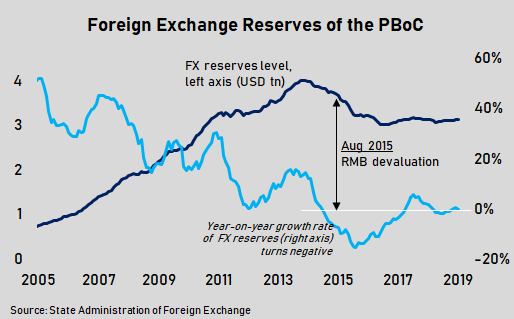
The PBoC aggressively sold foreign exchange in the FX market to support the value of the RMB in the face of bearish sentiment following the devaluation. The PBoC’s FX reserves declined from a peak of nearly USD4 tn in June 2014 to USD3 tn by the end of 2016.
Capital Account Liberalization
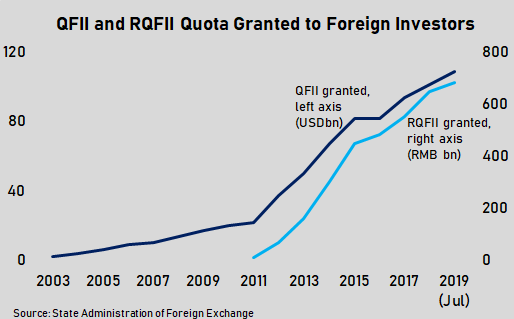
Inbound portfolio flows are regulated by quota based schemes for institutional investors like the Qualified Financial Institutional Investor (QFII) and its RMB counterpart, called RQFII. In 2018 restrictions on remittance of funds were removed and onshore hedging was allowed. Lately, the popularity of QFII has declined in favour of the stock connect schemes (see below).
Two-way Equity Flows

The two stock connect schemes allow global investors access to stocks listed in China, and Chinese investors access to stocks listed in Hong Kong. Northbound (i.e. China bound) flows over the first seven months of 2019 already exceeds the entire of 2018 as MSCI began the process of quadrupling the weighting of China A shares to 20% by end of 2019.
Foreign Investment in Bonds
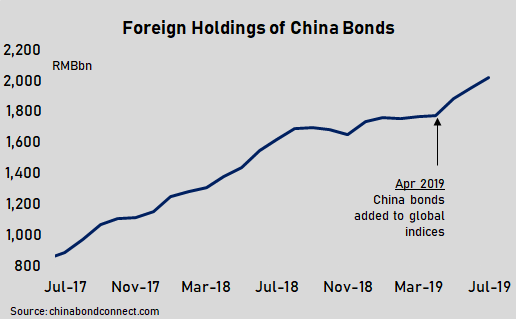
Foreign investment in China bonds has grown rapidly since the launch of the Bond Connect scheme in July 2017 but accounts for a meager 2% of outstanding bonds. Inclusion of China bonds in global bond indices in April 2019 has led to a jump in trading volumes.
World Holdings of RMB Reserves
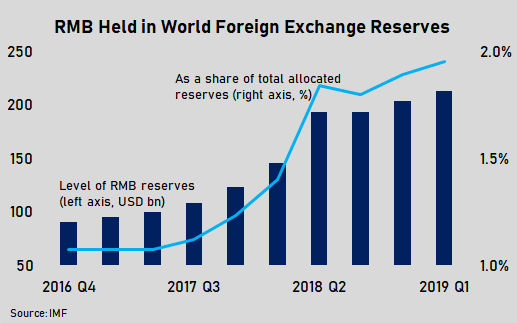
Since the RMB’s inclusion in the IMF’s basket of reserve currencies called Special Drawing Rights (SDR) in October 2016, holdings of RMB reserves by other central banks has risen to over USD200 bn or 2% of the allocated reserves of IMF member countries. This is largely driven by China’s trade and investment partners in Asia and Africa.
